Super Store Dashboard
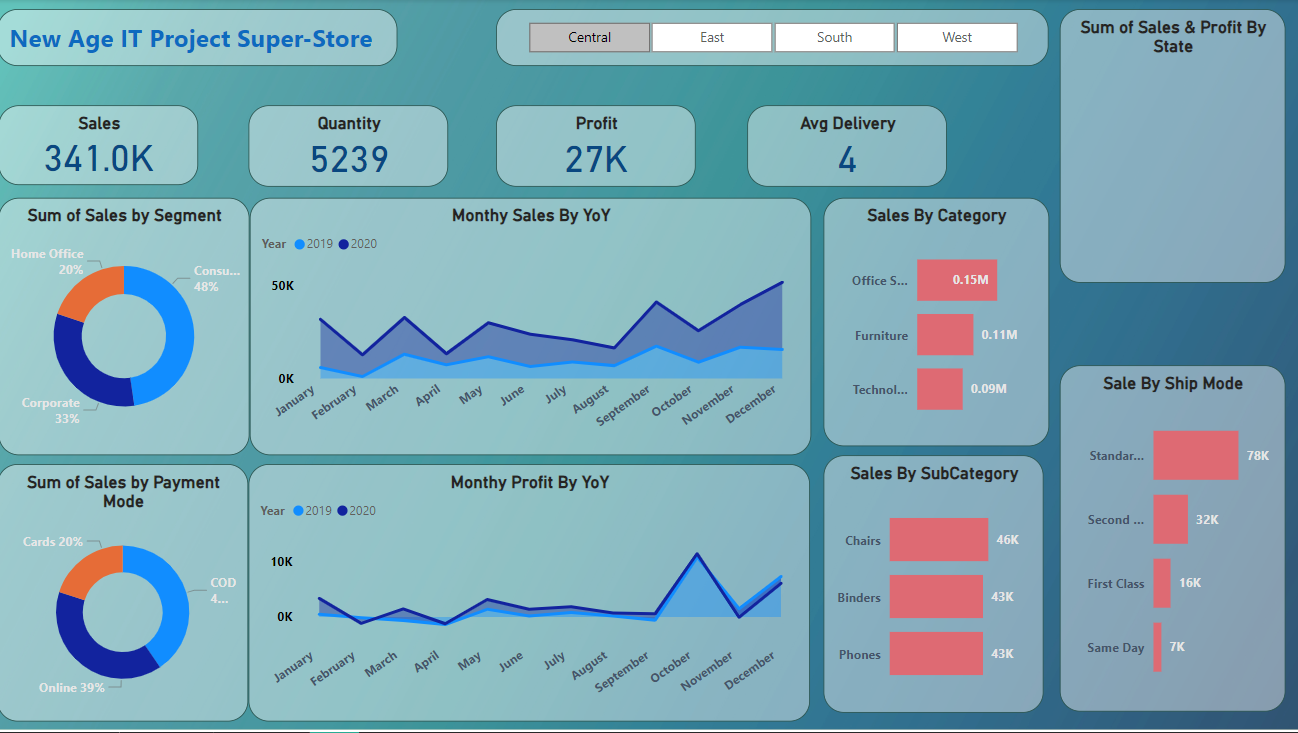
The Super Store Dashboard is a comprehensive Power BI template designed to help retail businesses monitor and optimize their sales, inventory, and customer data with actionable insights. This dashboard provides a holistic view of store performance, enabling data-driven decision-making for growth and efficiency.
Key Features:
- Sales Analysis: Track daily, monthly, and yearly sales trends to identify growth opportunities.
- Product Performance: Analyze best-selling products and underperforming items.
- Customer Insights: Understand purchasing behaviors and demographics.
- Inventory Management: Monitor stock levels and avoid overstocking or shortages.
- Profitability Metrics: Evaluate revenue, profit margins, and cost efficiency.
- Geographic Analysis: Visualize sales performance across different store locations.
- Dynamic Filters & Drill-Downs: Easily explore data by category, region, or time period.
Technologies Used:
- Power BI: To build interactive visualizations and reports.
- DAX (Data Analysis Expressions): For advanced calculations and data modeling.
- Power Query: To clean, transform, and load data efficiently.
- SQL/Excel Integration: Seamless data import for enhanced reporting.
- Custom Visuals: Slicers, KPIs, and heat maps for deeper insights.
This dashboard is perfect for store owners, managers, and analysts seeking to enhance operational efficiency and boost profitability.

Reviews
There are no reviews yet.