PROBLEM STATEMENT
A US Based Ecommerce Sales Company wants us to create a Sales Dashboard showing information of YTD Sales and generate insights for below scenarios-
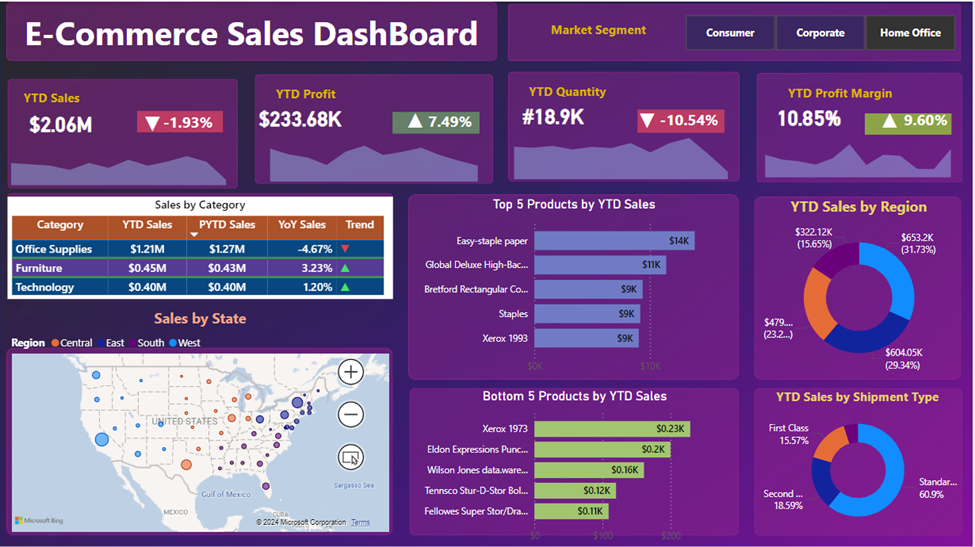
- Create a KPI Banner showing YTD Sales, YTD Profit, YTD Quantity sold, YTD Profit Margin
- Find Year on Year growth for each KPI and show a YTD sparkline for each measure in the KPI to understand the monthly trend for each fact.
- Find YTD Sales, PYTD Sales, YoY Sales growth for different customer category. Add a trend icon for each category.
- Find YTD Sales performance by each State
- Top 5 and Bottom 5 Products by Sales
- YTD Sales by Region to know best and worst performing region all over country
- YTD Sales by Shipping Type to get the best shipping type percentage
STEPS IN PROJECT
- Problem Statement
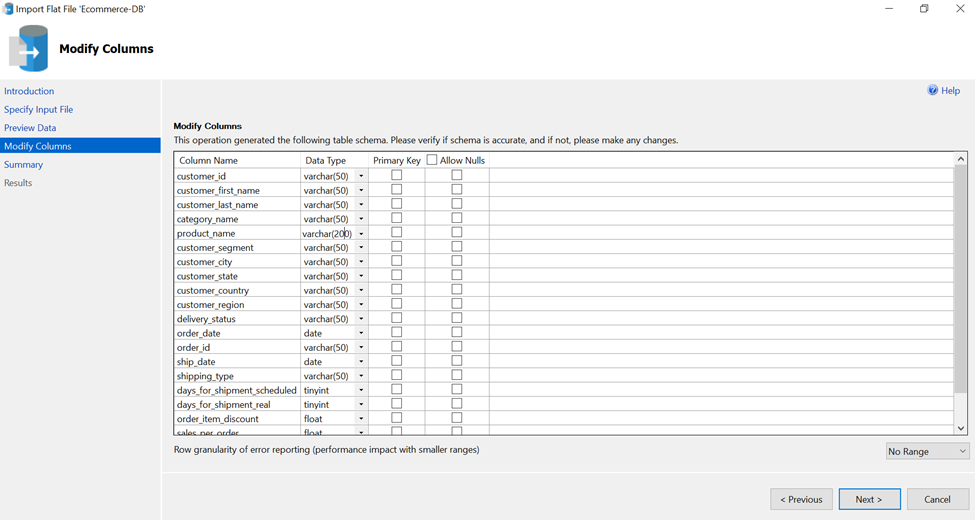
- Import Data in MS SQL Server
- Connecting Power BI to MS SQL DB
- Data Cleaning
- Data Processing
- Data Modelling
- Creating Date Table
- Data Visualization
- Creating Dashboard
- Generating Insights
Milestones Achieved
· How to connect Power BI to MS SQL server and Flat Files
· Data Modelling with three tables
· Data cleaning in Power Query
· How to create a Date Table in Power BI
· Time Intelligence function (TOTALYTD, SAMEPERIODLASTYEAR, etc)
· Creating Dynamic and Complex KPI’s
· Basic to Advanced Dax Queries
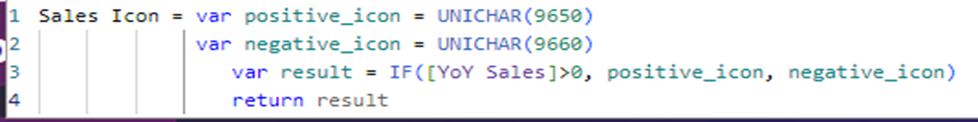
· Conditional Formatting’s, Adding dynamic icons in Power BI
· Different DAX functions like Calculate, Sum, Sumx, Filter, values, selectedvalue, return, concatenate, divide, var, etc
· Creating different charts, maps and formatting then
· Generating insights from charts
· Export report
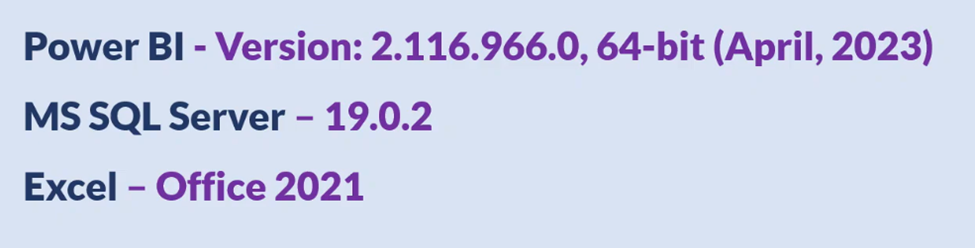
Software Used:-
Data Fields Definition: –
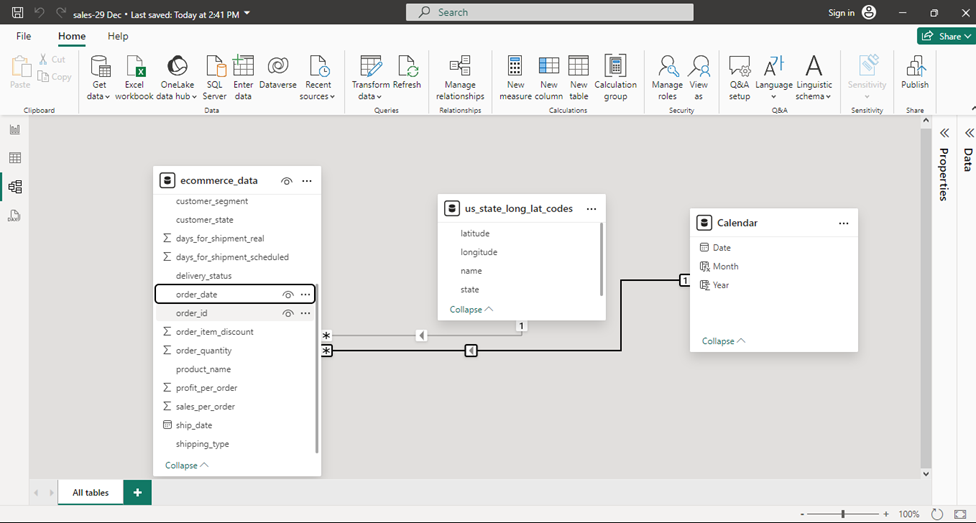
Data Modelling
Data Bars coloring based on Conditions
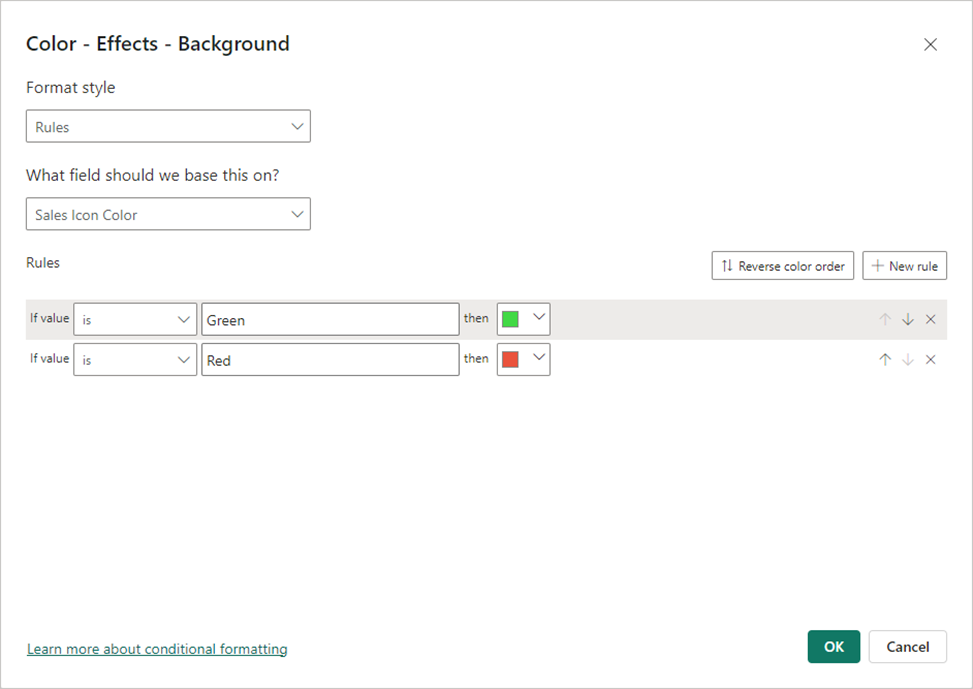
Color Selection based on Results